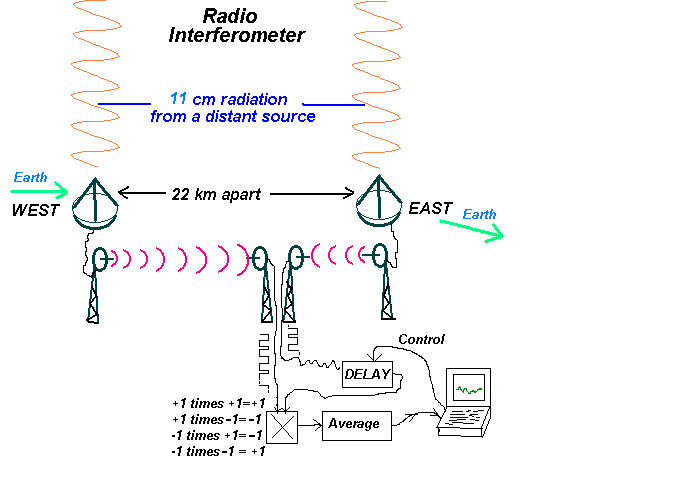
If only noise is entering the antennas, these four possibilities will be equally likely and each will happen one quarter of the time. If we multiply the bits together and average the result, the average will go to zero.
         1. The bits are the same and are both +1,


         2. they're the same and both -1,


         3. West is -1 and East is +1,


         4. or East is -1 and West is +1.

In the very unlikely event we receive a signal from ETI (Extra Terrestrial Intelligence),
we will spot a positive number or a negative number in our data. Sort of like the -20
that popped out of the data shown below, but THIS IS NOT FROM ETI!!!. Well, I really don't
know where it came from. My guess it is noise, but it could have been a glitch in the radio links.
I SAY IT IS NOT FROM ETI.
The spacing in time between lines in the tables is about 1.6 seconds. We use the Julian Date
because it keeps track of time and date with one number. The number changes by one every day.
Julian Date        the seven delays          a number
						indicating how far off
						the PC clock is from the
						Earth's standard atomic clocks

2451405.68811 -6  -2  -6  -5  -3  -3  -1     -9
2451405.68813 -10 -5  -2   0   7  -7  -9     -9
2451405.68815 -2  -8  -2  -6   0  -1  -3     -9
2451405.68817  0  -2  -6   3  -13  1   7     -9
2451405.68819 -2  -2  -3  -3  -2  -9  -5     -9
2451405.68821  0  -1  -3   0  -12  4  -4     -9
2451405.68823  0   0  -1  -5  -5   0  -8     -9
2451405.68825  4  -4   0  -5  -8  -7  -1     -9
2451405.68826 -4   4  -4   0  -11  0  -1     -9
2451405.68828 -5   3  -6  -1  -7  -4  -8     -9
2451405.68830 -5  -9  -1  -4  -4  -11  8     -9
2451405.68832  0   0  -4  -3  -6  -7  -5     -9
2451405.68834 -11 -1  -6   0  -20 -6  -7     -9    <<<<<<<< THIS IS  _NOT_  ETI   !!!!
2451405.68836 -3   0  -1   0  -1  -1  -9     -9
2451405.68838  3   0   0   0   0  -4  -4     -9
2451405.68840 -6   0  -8  -2   5  -2   0     -9
2451405.68842  2  -8  -4  -9  -5   0   0     -9
2451405.68844 -4  -5   3  -6  -13  2  -2     -9
2451405.68845  3  -5  -7  -12  0  -12  5     -9
2451405.68847 -2  -1   0   4  -1  -4  -4     -9
2451405.68849 -6  -4  -6   2   1   0  -1     -9
2451405.68851  1  -1  -1   6   4   0   0     -9
2451405.68853  5   7  -3   0   2  -5  -2     -9
2451405.68855  4  -3   0  -11 -1   1   1     -9
2451405.68857 -2   0  -8   6  -3  -3  -2     -9
2451405.68859 -1  -3  -3  -2  -5  -5  -2     -9
2451405.68861  0   0   2  -1  -1  -5  -4     -9


An object in the sky, such as a black hole, might look like this:


2451405.68891 -2   0  -1   3  -6   0   0     -9
2451405.68893  1  -6  -2   0  -3  -8  -6     -9
2451405.68895 -6   3   4  -2  -2   2  -6     -9
2451405.68897  5  -2  -4   0   1  -10 -7     -9
2451405.68898  1  -1  -2  -4   3  -3  -5     -9
2451405.68900 -1   0   1   4   0   3   1     -9
2451405.68902  0  -5  -3   3  -1   1  -3     -9
2451405.68904  3  -8  -7  -1   6  -4  -5     -9
2451405.68906 -1   0   0   0   0  -4  -6     -9
2451405.68908 -1   0   1   0   0  -1  -6     -9
2451405.68910  4   1  -1   7  -7  -8  -3     -9		< Note that the fifth data column
2451405.68912  6  -7   2  -3  -1  -6  -1     -9		< numbers are mostly
2451405.68914  5  -3  -1   0  -4  -3  -4     -9		< negative (around here). This may
2451405.68915 -5   4  -2   0  -8  -3  -2     -9		< be from something in the sky,
2451405.68917 -2  -13  0  -9  -5  -6  -2     -9		< or maybe due to some drift
2451405.68919 -7  -3  -7  -7  -4   4  -3     -9		< in the receiver. The receiver
2451405.68921  0  -5   1  -4  -1  -7   1     -9		< is being improved, and more
2451405.68923 -1  -4  -1  -6   1   3  -9     -9		< data is being taken.
2451405.68925 -4   0  -5   4  -6  -10 -2     -9		< By looking at the same point
2451405.68927  0  -6  -2  -1  -8  -3   0     -9		< in the sky two days in a row,
2451405.68929 -2   0  -1   7  -1  -2  -3     -9		< and compensating (about 4 min. per day)
2451405.68931  0  -7   0  -3  -3   1  -10    -9		< for the Earth's orbit around the Sun,
2451405.68933 -2  -3  -1   0  -1   1   0     -9		< we see this  plot .
2451405.68934  0  -10  0   1   2   0  -6     -9		(It's not at the same time as this
2451405.68936 -6   3   0  -4   0   0   0     -9		  tabular data. Note the interesting
2451405.68938  2   2  -3   1   0   2  -3     -9		  daily repetition in the plot.)
2451405.68940 -1   0  -3   3   0  -4   0     -9
2451405.68942 -3   0  -1  -3   0  -6   4     -9
2451405.68944  0  -2  -3  -1   1   0   0     -9