must be Skip!"
I retorted, "Wow! We need YOU to analyze our SETI data!"
The young woman, Fauna, I think, remembered our names a week after her science teacher,
Rick Alm, mentioned to his Priest River Lamanna High class that he had received a letter from me.
I'm planning to visit their school this Friday. Update: Oct. 6, 1999:
I taught Astronomy all day Friday. Wow! I had a bunch of fun! What a great group of students and educators!
I added to this web page a description of the Mabuhay radio interferometer. It's here.
Aug. 18, 1999:
The long baseline radiotelescope crosscorrelator seems to be working better. Preliminary results are at:
Radio Astronomy update
Aug. 8, 1999:
I'm having tons of fun writing software on the Linux machine to process the enormous amount of data from the
cross-correlator. I'm not exactly sure about what I am seeing in the data. I'm pretty sure most of it is an artifact of the marginal
microwave link from SCC. We're going to improve that. The rest of it might be real astronomical objects.
So I'm real anxious to get the link improved so we can look at the objects, e.g. quasars and supernova remnants.
A very funny thing happened today. A dark green jet helicopter zoomed about a hundred feet over the three LL antennas, then climbed
away fast! I have never seen anything like this in nineteen years of sky-watching.
Someone told me that this same sort of low-flying helicopter event has been
happening often over the LL antennas, starting about a month ago. The funny thing is...that's when I turned on the
Mabuhay!SETI system.
Please, do not e-mail me with your conspiracy theory. And, I want to make it very clear to everyone that
I am accurately reporting (almost)
every last SETI thing I am doing. It's all written right here on this page.
So, please, there's no need to check up on us...oops, I mean, me. ;-)
July 19, 1999:
SETI with the Mabuhay! system has officially started!! (with reduced sensitivity)
The 22 km baseline interferometer with cross-correlator
is running and capturing data around the clock. Effectively
this system is searching the sky for correlated signals of any modulation type - as long as the signal is confined
to a 2.5 MHz bandwidth. Integration time is about 0.2 seconds. The system is real-time and uses two microwave links to bring 2.5 MBit/s
data to the processing center. Effectively we have a sensitivity approximately equivalent to
a CW bandwidth of about 2 kHz. Any type of modulation, however, not just CW tones, will show up as a peak in the cross-correlation.
Delay is swept to check for sources slightly off axis. Interferometer fine lobe resolution is about 10 arc seconds;
the interference fringes have been stopped on the sky
by offsetting an LO at one site by 11.4 Hz. Atomic and GPS clocks get the absolute LO frequencies to within about 0.1 Hz at 2.7 GHz.
Site to site delay was measured using a GPS-derived one second pulse from each site.
Data on quasars and other radio objects has been obtained from the GB6 catalog data base,
and the peaks of the cross-correlation
we are seeing are being compared against the objects in that data base. Radio astronomy sensitivity is about 4 Janskys.
More detail will be added to this web page in coming weeks,
including a block diagram of
the interferometer, and the quasars we think we are seeing.
July 11, 1999:
The 3.0 meter and 4.6 meter antennas each have one polarization working with 2.5 MSPS baseband data
and calibrated noise temperature values sent over two microwave links
(SCC to Agilent Technologies and Liberty Lake to Agilent Technologies).
2.7 GHz antenna noise temperatures and 22 km spaced interferometer cross-correlation is being logged
almost continuously. The FPGA FFT signal processor design is being improved to use four 1 million gate FPGAs.
Speed improvements may allow
each signal processing card to perform fourteen 4M point FFTs (real time) every two seconds (twice as many FFTs as previous planned).
The number of simultaneous beams formed will be doubled if the faster design works. And more antenna feeds may be added to contribute
to the beamforming calculations.
Two processor cards are planned to be installed into PCI slots on two x86 systems running LINUX.
The FPGA digital design is finished and works well. The design is being translated to
code to load into the FPGAs. The PC board layout for the FFT/beamforming signal processor is starting. One or more of the northern Idaho
to Agilent Technologies three-hop microwave links has been down for about a month. Troubleshooting is underway. The SCC to Agilent Technologies link bandwidth is planned
to be increased to about 20 Mbps (from 2.5 Mbps) this year.
Hypothesis and Speculations
We seek relatively short,
isolated pulses (each only a few seconds in duration).
Our hypothesis is that short pulses sent by our neighbors in the Milky Way Galaxy are significantly separated in time,
perhaps by days or weeks.
The highly speculative thought driving this hypothesis is that a civilization may wish to announce its presence
while simultaneously minimizing
interference to technologically-emerging fragile civilizations.
Announcing one's presence in a "non-interfering way" appears quite problematic.
However, a highly improbable single pulse event arriving from a measured direction gives a clue as to where to subsequently
look.
All this leads to the
question of how to follow up a "first pulse detection" given the
clutter of human-produced electromagnetic artifacts that look like "first pulses".
Perhaps we can ameliorate this interference situation by doing the following:
-Very clear and/or well-regulated frequency bands are being sought.
-Multiple dish antennas are located at two of the sites.
-Site-to-site antenna separation will allow dish beamwidths to reject interfering signals, to about 5000 km.
-Site-to-site Doppler shifts will be used to reject interfering signals, perhaps to about 100,000 km.
-A broad beamwidth antenna located at the central site, driving narrow and wide bandwidth receivers,
will check for dish off-axis interference.
-Accurate direction of arrival will be measured using monopulse radar signal reception techniques.
-Each pulse's direction of arrival will be archived.
-The same sky locations will be repeatedly searched.
Doing all this might help. However, I do not think it will help enough for the Mabuhay! SETI Project; our system is just too small.
Further work is certainly required here; signal processing ideas will likely evolve.
System Description and Status
Much work remains to get this system working; this description is preliminary.
Antennas
We have obtained, through generous donations, seven parabolic dish antennas.
The antenna diameters are: 3 m, 3 m, 3.7 m, 3.7 m, 3.7 m, 4.6 m, and 6.1 m.
The seven antennas are presently located at four sites in Washington and Idaho.
Four of the antennas have been set up and are prepared to have feeds installed. The remaining antennas have mounts
finished, with the exception of the 6.1 m.
We are planning to motorize the pointing of one of the seven antennas.
This steerable dish (which is 4.6 m dia.) will be pointed to "certain peculiar" places in the sky.
The remaining non-steerable antennas will search about one degree of the sky around a fixed declination.
For several hours a day, five of the antennas will be pointing close to the plane of the Milky Way galaxy.
The 6.1 m antenna will be used sometime after the others are operational.
We plan to monitor frequencies around 2.8 GHz at each site,
using two orthogonal polarization feeds per antenna.
Low Noise Amplifiers
Several 2.8 GHz Low Noise Amplifiers have been built and tested.
Agilent Technologies (split from Hewlett-Packard) ATF-36077 transistors are being used.
Measured amplifier noise temperature is 34 Kelvins. A total of fourteen amplifiers need to be built and tested.
Receivers
A GPS-frequency-locked receiver
connected to each feed will produce four million baseband samples
per second, corresponding to a two megahertz segment of the input spectrum. We are carefully measuring the
phase shift through each receive path, so that signal polarization may be measured.
Remaining receiver work mostly involves loading parts on PC boards, packaging and testing.
Microwave Links
Baseband samples from each of the receivers are brought to a central site using microwave radio links.
Data is sent over each link at a maximum rate of about twenty megabits per second.
The microwave link center frequencies are chosen to be in various amateur radio bands. About 90% of the
microwave links' installation and testing has been completed.
6/15/99 update: All links have been working. Every now and then (like right now) something bad happens
and we have to go up the side of a mountain to fix it.
Central Processing Site
At a central processing site, seventy simultaneous real-time antenna beams will be formed.
The beams each represent a pointing direction.
For each of four million frequency channels, the power in each of these antenna beams will be measured.
If the power exceeds a threshold, raw data will be archived.
Signal processing is performed using a combination of FPGAs (Field Programmable Gate Arrays)
and x86 Processor hardware and software.
Field Programmable Gate Array-based Signal Processing
We are presently designing two FPGAs that together perform a
56 million channel FFT (Fast Fourier Transform), a seventy-beam antenna beam-former
and a four-baseline radio interferometry cross-correlator. The 56 million channel FFT is actually fourteen
parallel-calculated four million point FFTs.
The beam-former takes the outputs of a set of antenna FFT bins, (a bin=a frequency channel) and calculates a composite signal,
similar to that of a phased array antenna. In this processing case,
though, seventy phased array antenna beams
simultaneously
monitor every 0.5 Hz wide FFT bin.
The effective area of the most sensitive synthesized antenna beam
is equal to the combined effective area of all of the antennas.
(This is about equal to the area of a nine meter dish.)
The number of frequency channels monitored in each synthesized antenna beam
is only four million because
each of the twelve antenna feeds uses one of the fourteen parallel-calculated four million point FFTs.
Two remaining four-million-point FFTs are
used to measure
off-axis interference picked up by a single wide-beamwidth antenna. All FFTs are performed in real time,
i.e. all sampling
and transforms are done without gaps in time.
Effectively, we hope to have an overall search system that is roughly equivalent
to having about ten seven-meter dishes pointing in ten directions.
Each pointing direction will have a four million channel receiver "listening" (with 0.5 Hz bandwidth per channel).
The signal processor consists of two circuit boards, each with two 100,000 gate FPGAs,
and many fast SRAM ICs. (A circuit board will measure all antenna signals, for one polarization.)
Each circuit board will be interfaced to a dedicated host x86 processor over a PCI bus.
Given the number of FFT points and the Transform Time (56 million points in two seconds), this doesn't seem like much hardware.
There are several reasons for this. The FFT is a two-dimensional
algorithm that uses the x86 SDRAM for "row-column" storage. Small fast SRAMs are used for the one dimensional FFTs.
The FFT algorithm is implemented using optimized word widths throughout the design, given that low Signal-to-Noise Ratios are present.
The trigonmetric calculations in the FFT are implemented using a compact CORDIC algorithm.
And, very dense field programmable gate arrays are being used. The hardware FFT system is roughly (performance-wise) equivalent to a
few hundred x86 processors running conventional one dimensional FFTs.
All of the circuits to be placed in the FPGAs have been tested in gate-accurate simulation,
and the design of the PC board for the FPGAs has begun. Nevertheless, finishing the signal processor
in 1999 is a huge challenge.
Radio Astronomy using the Mabuhay! System
Radio interferometer cross-correlators and noise temperature
measurement techniques will be used to verify that the antennas are all pointing at the same spot in the sky.
Also we need to be sure that
the receivers are tuned to the same frequency. Granted, there are other (less fun) ways to do this.
Plus Radio Astronomy is a kick. :-)
Drift scans of Cygnus A are seen in plots.
6/15/99 update:
A real-time cross correlator is being built for the 22 km spaced SCC and Liberty Lake antennas.
It should be working by mid July 99.
Hopefully we will see fringes (an interference pattern) due to the distant spacing of the antennas.
Delays need to be equalized to within 100 ns, and frequencies accurate to 1 Hz at 2.7 GHz. All the parts are
laying around here to do this; about fifty wires need to be (properly) connected. And I need to write
about a hundred lines of C code to control things and get the data into a nice file. If you are interested in details,
the interferometer system is: local meridian transit, linearly polarized, one bit real sample per feed, five megasamples per second,
(changed to 2.5 MSPS),
(approx) 100 ms integration time per delay step, thirty-two 200 ns delay steps, frequency reference uses GPS-locked quartz and atomic clocks,
and the system uses micowave link transmitted GPS time to measure and equalize the (approx. 63.4 microsec.) delay.
Two microwave links are used (they are described in a section below).
The long baseline interferometer may be working... The plot shows the cross-correlation as the
interferometer sweeps the sky. One delay was chosen to plot. Other delays also show some interesting fluctuations.
It is too early to know if the bump at x=0.875 is Cygnus A. More sky sweeps are being taken. The regular glitches at five
minute intervals show the effect of the 290 K noise calibration source being switched in. We expect to see the correlation drop
to zero when 50 ohm loads are placed simultaneously at the input of the LNAs.
However, it's too early to say if the drop to zero is in fact due to the different sky / 50 ohm load correlation.
Update: July 9, 1999 : The cross-correlation pattern for Cygnus A did not repeat when re-checked. Troubleshooting is underway.
Cygnus A as it affects antenna temperature was recently measured at Liberty Lake and is shown in this plot.
Update: July 11, 1999 : We now transmit antenna noise temperature for each antenna as well as the 2.5 MSPS data over the link.
Cygnus A as it affects antenna temperature was measured at SCC and is shown in
this plot. We plan to troubleshoot the multiple peaks the night of July 12.
Update July 12, 1999:
Cygnus A at SCC for Julian Day =...1370
Cygnus A at SCC for Julian Day =...1371
The double peak is there for a second day. This will be worked on today. The other glitches went away.
Others may have appeared (not in plot). We may have an intermittent switch in the 290 K cal system. The double peak seems
to drift to the left by the expected 0.00274 day per day. Samples are taken five minutes apart, so it's a little hard to be sure
about this.
Cygnus A at SCC for Julian Day =...1370 and 1371
Update: July 15, 1999
It looks like the SCC and LL antennas are finally pointing at the same spot in the sky. The SCC dish was moved to about 6 degrees
from vertical and measurement re-run. The following shows the alignment of the SCC and LL antennas by (approx.) interleaving the
temperature data of the two antennas on the same plot. The bump at about x=0.87 is Cygnus A.
It appears that the coma lobe to the left of the main lobe exists similarly on both antennas. Perhaps it is not a coma lobe?
I'll have to re-check the Cambridge 3C catalog.
Perhaps the cross-correlation between the antennas will show daily features now...
Cygnus A at SCC and LL with data interleaved for Julian Day = 2451374.
The SCC antenna was re-pointed again about 1 degree south. The double peak of the SCC antenna seems to be returning. The focus of
the SCC feed may be a little off. Or perhaps the original pointing (indicated 6 degree south of zenith) is correct.
Cygnus A at SCC and LL with data interleaved for Julian Day = 2451376. It doesn't look too bad.
Update: Aug. 5, 1999: Ray re-pointed the SCC antenna to 7.5 deg S of zenith (indicated) the evening of Aug. 3.
The Aug. 3-4 SCC data was corrupted during the Cygnus A pass due to some unknown microwave link problem.
The data from last night though was OK.
So here it is. It looks quite good.
The previous SCC data indicating a double peak of 10 degree rise in the noise temp for Cygnus A
is very questionable.
It repeated for two days while the SCC antenna was pointed away from Cygnus A.
Another possibility is that both SCC and LL antennas are now tweaked to the same mis-focus and mis-pointing.
If this is the case the sensitivity would be much less than what is possible. Further experiments with the LL antenna
will be done to disprove this hypothesis. Cross-correlation data shows many interesting peaks but no diurnal effect has been found yet.
I haven't processed and compared the last few nights of data yet.
Update: Aug. 7, 1999: We verified the SCC/LL pointing again last night.
JD 2451397.6 SCC/LL comparisons.
We decided to point the LL antenna way off to check the cross-correlation peaks with expected zero correlation.
To do this the LL antenna was steered 25 deg S of the zenith from its previous direction of 7.5 deg S of zenith.
The re-pointing was done at Julian Date 2451398.309.
Update: Aug. 9, 1999:
Cross-correlation seemed minimal after the antenna was "mis-pointed", as expected.
Last night's set of files cc35.txt and ta35.txt didn't get written to for some reason. The antenna was pointed back to the original
7.5 deg S of zenith around 2451400.063. File writing will be checked today into cc36.txt and ta36.txt.
The processing computer clock drifts very bad. So yesterday I made some changes to the LL program. GPS time from the
GPS receiver at the LL site is now being sent over the
LL-Agilent Technologies link and placed into the antenna temperature file. The link transmission is not sync'd to the one second GPS clock
so the reported time is probably accurate to only about 1 second.
Update: Aug. 18, 1999:
There is quite a bit of baseline drift, due to a marginal microwave link. To make matters worse,
we are calibrating the noise temp too often and too long, so a high percentage of the time we are not measuring the sky.
Another problem is we send serial data over the links at too many times, potentially corrupting the cross-correlator data.
To fix this we need to improve the SCC-Agilent Technologies microwave link, and modify the radiotelescope programs at the sites.
We are working on all this. The following is a plot that seems to indicate several objects in the Milky way.
The telescope resolution is calculated and measured to be about 5 arc seconds in Right Ascension (the antennas are close to East-West spaced).
This plot shows the cross-correlation on two successive days, looking into the Milky Way
in Cygnus. The apparent object seen at 20.235 RA hrs may be ADG073.8+01.0 which is in The Master List at 36 10 14.8 decl.
However, we think we are looking at
40 deg. decl. The object in the list has a flux of 13.0000 Janskys at 2695 MHz.
We may be seeing that object on the side of the main lobe.
There are no other objects at these RAs in the Master List
stronger than 100 milliJanskys from 35 to 45 decl.
It appears that the sensitivity of the telescope may be
well below 1 Jansky. More calculations and measurements are required to confirm this.
The vertical axis of the plot is the cross-correlation for "bin 4" which is a particular step in the 200 ns step digital delay line.
The blue lines show when the radiotelescopes were looking at the reference 290 K noise source.
Minimal cross-correlation should be expected during this time. However serial data is sent during the cal periods, so
data can be corrupted. Plus, the baseline drift problem needs to be improved.
SETI Site Images
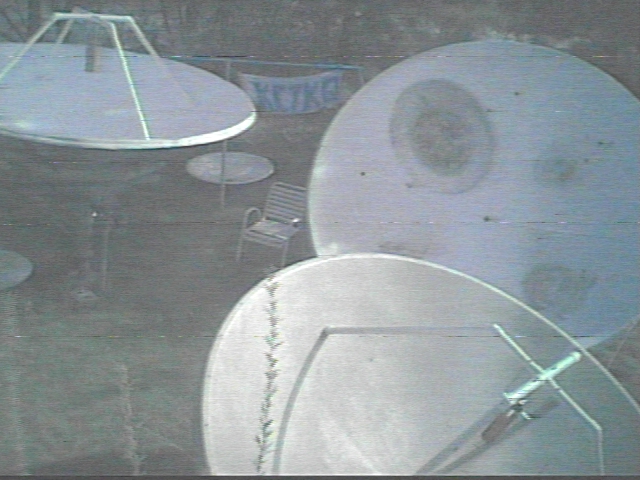
This image was obtained from a microwave-radio-linked video camera. At some time (about) every day,
(soon to be automated) an image is captured, in whatever state everything is in. 6/15/99 update: There is too much work to do, so
I'm not going to play any more with the remote video cameras.
Three SETI dishes (3 m, 3 m 3.7 m) are in the background.
Other images on this page do not automagically update. Some may soon, though... 6/15/99: No.
Microwave links have been tested by transmitting live video using FM.
The image shown below is frame-captured video sent 2 km (the link frequency is around 2.4 GHz; we are QSYing (changing frequency)
to 3.4 GHz because of severe QRN (static) from microwave ovens at 2.45 GHz.
(update 2/8/99: 3.4 GHz is installed and works very well.)
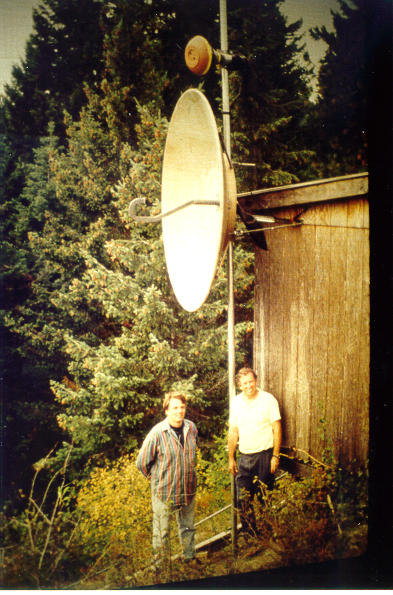
At this receiver site we set up two 3 meter dishes and one 3.7 meter dish.
Another site is shown below.
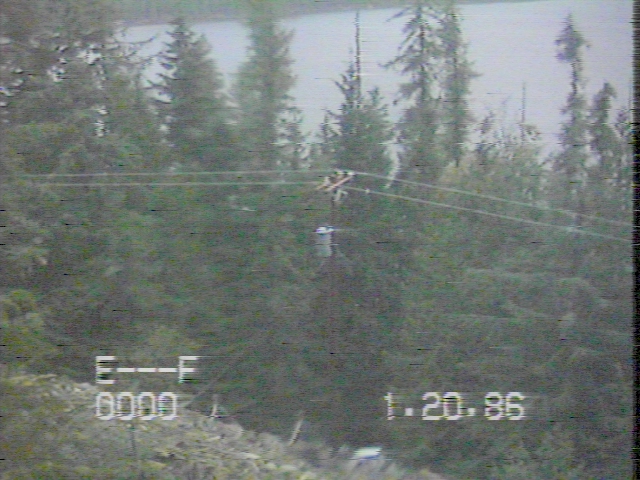
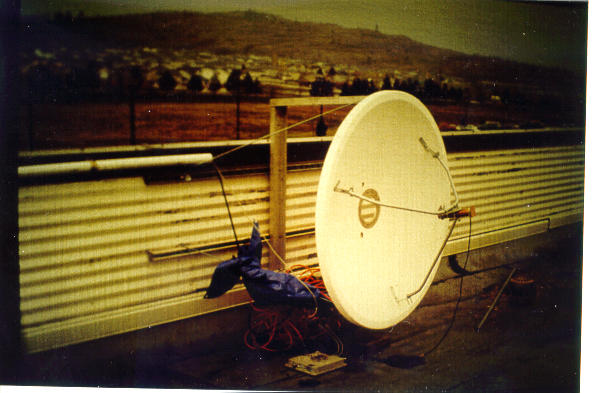
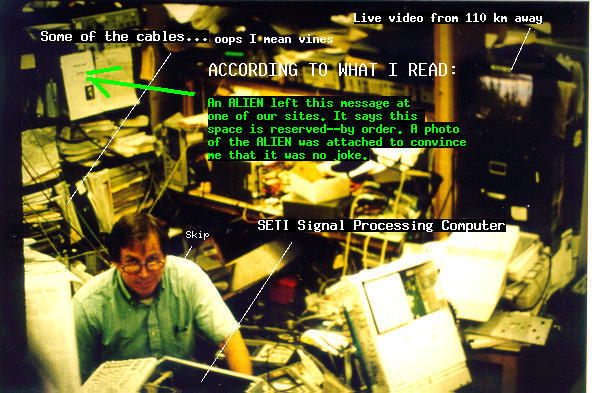
This image is derived from frame-captured video sent 110 km using
three microwave links (freqs. one at ~3.4 GHz, another at ~5.7 GHz,
and another at ~5.7 GHz). These links were a huge challenge to install.
However, we had lots of fun and met many nice people who helped us a bunch.
Two dish antenna tripods are set up and may be seen down the slope. The white spot slightly to the left and below the "1"
is one of the two 3.7 meter dishes at this site.
The numbers and other artifacts in the image are produced by the video camera,
which has a dead Real Time Clock battery but now conveniently displays the number of days
the camera power has been on (twenty days in this case).
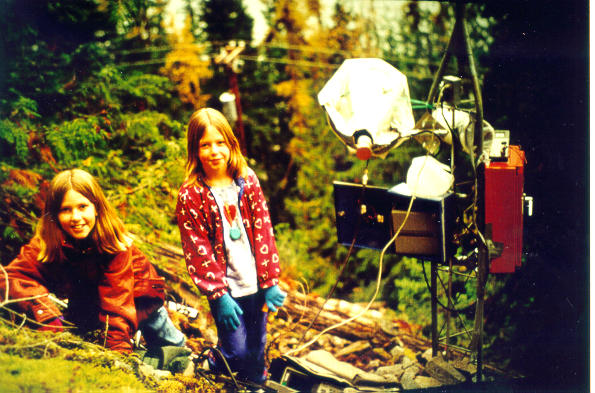
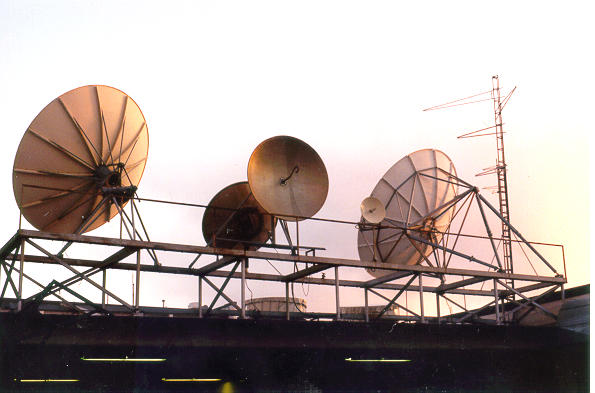
Our third SETI receiver site is shown in another image.
The 4.6 meter antenna on the left in the image is dedicated to SETI. The tower on the right holds a small microwave link dish
(installed after the picture was taken) to send seven megabit per second data to the central processing site,
about twenty-two km distant.
Mabuhay! SETI System FAQs:
Will the Mabuhay! SETI System receive anything unusual?
I do not expect to receive anything unusual using this system
because I think we need more dish antennas, more microwave links, and more FPGAs.
Plus I think that intelligent civilizations
in our galaxy are being very careful to not interfere with our communication systems, radars,
missile defense systems, etc.
I do not expect a strong, long-lasting CW carrier, for example. This is certainly speculation, but is just my guess.
This Mabuhay! SETI project is basically an attempt at a "null experiment": cancel out everything as best we can and
look at what is left.
I expect nothing. And, if anything unusual does appear in our data, I am going to be very skeptical about its
possible extraterrestrial origin.
Why have you chosen to listen at frequencies "around 2.8 GHz"?
If civilizations are trying to not interfere with us, then
there may be no magic frequency. Maybe they pulse their transmitted energy on different frequencies.
If this is true, then the best frequencies for us to listen on may be the ones with the fewest human-produced photons.
I've been reading as much as I can about US and International frequency allocations. I found that the 2.69 GHz to 2.9 GHz
frequency range has only two well-defined allocations: protected radio astronomy below 2.7 GHz; and
Airport Surveillance Radar (ASR) and other ground-based radar, using frequencies between
2.7 GHz and 2.9 GHz.
Unfortunately for SETI, many militaries have numerous Airborne Self-Protection Jammer (ASPJ) systems.
Many of these will presumably jam the 2.7 to 2.9 GHz radar band using various CW and modulated signals.
These potential jamming signals make the 2.7 to 2.9 GHz SETI search a little difficult.
To make matters worse, the pulses from the ASR radars are very
powerful, and will certainly produce noticeable reflections off of satellites.
However, I expect these reflections to be quite broadband, and perhaps easily identified.
I have learned that CW Doppler radar is not permitted in the 2.7 to 2.9 GHz band; that helps.
I don't know if anyone has the capability to jam 2.7 to 2.9 GHz frequencies from near or deep space.
My guess is no. Pilots fly the airplanes, and ASR radars are there to help them, but
I think we would have a mess on our hands if a satellite-based ASR jamming system
were to go awry.
This all sounds quite bad, but overall, I think the 2.69 GHz to 2.90 GHz band
seems fairly free of "unknown" interference, (except for maybe the airborne jammers)
and is particularly free of isolated CW carriers. Harmonics and other spurious signals are, of course, always an issue.
Presently I examine local interference with an automated spectrum logging system comprising an Agilent Technologies 8566B Spectrum Analyzer.
I have placed a small dish/BPF/LNA on the roof here, and plan to add other types of antennas to the system. In general,
I think I need to choose some frequency range, get to know it well, then do the null experiment.
If you want more information on interference in various frequency bands, there are many resources on the web:
A US frequency allocation chart is at
http://www.ntia.doc.gov/osmhome/allochrt.html.
A Canadian frequency allocation chart is at
http://strategis.ic.gc.ca/SSG/sf01608e.html.
In addition I found numerous very useful spectrum allocation papers from the NTIA:
http://www.ntia.doc.gov/osmhome/reports/pub9835/Raspexec.htm(Radio Astronomy allocations).
http://www.ntia.doc.gov/osmhome/reports.html(Spectrum Engineering Reports)
http://www.its.bldrdoc.gov/pub/pubs.html(papers plus links to very extensive Denver and San Diego spectrum studies)
Why are you working on this project?
I am working on this very fun project because I love astronomy
and I love to build radios, antennas and computers.
In addition, I do hope someone receives something interesting, someday. Maybe a tiny idea from this will help the big searches that we need to do.
Or maybe we can just point this and listen when and if someone ever picks up something interesting. That would be fun.
When will this Mabuhay! SETI system be working?
Hopefully in this century! I started building it in early 1996.
Do you believe in UFOs?
No. When I can touch and examine a UFO, i.e. hold a piece of a hypothetical space ship, I might start to believe in them.
I admit that UFO "sightings" certainly have had a very emotional and in some cases, physical effect
on many people.
How is your pulse receiver any different from a camera snapping UFO pictures?
The Mabuhay! SETI Project is an attempt to build a machine that unemotionally grabs artifacts from the universe,
if they can be grabbed.
You can build a similar machine and obtain similar results in a reasonable time.
If any UFO is a real flying machine, do you think they are from outer space?
I strongly believe that I need to accept and work with the Physics that I know about now. Anything else is speculation and/or
the work of Theoretical Physicists,
which is very interesting to me, but doesn't let me perform a SETI experiment today.
Using known Physics, I know star travel is very difficult.
A starship's energy consumption becomes almost unimaginable.
On a starship, clocks, distances, and mass change as we watch the ship go out on its mission.
In fact, the mass approaches infinity as the starship approaches light speed.
Albert Einstein's Theory of Relativity explains this uncanny starship travel and predicts the difficulty
of travelling at close to light speed. Sending radio messages is much, much easier, and is far more likely to be expected from our
neighbors in the universe. So I'm expecting radio messages to be sent to us, not flying machines.
I have written a
DOS program that graphically shows you the spacetime and mass of a starship as it approaches light speed.
In addition, the program shows you why the Theory of Relativity explains the strange effects.
Click here to download the zipped space.zip file.
After you unzip the file,
run the .EXE file in a DOS window, press the up and down arrow keys to change starship speed, exit with the space bar or the
escape key. There is also a text file included that explains the program and why the starship gets so massive
as it approaches light speed.
My good friend Joe Dubner has translated the DOS program into a very nice Windows 95/98 program.
Click here to download the zipped SpaceW.zip file (~600kB).
What does "Mabuhay!" mean?
"Mabuhay" is a friendly greeting (translated "Long Live.."),
spoken in the Philippines.
My American parents raised me in that beautiful country. I chose the name "Mabuhay"
because of its friendly meaning. (Plus, ET civilizations have to "live long" to communicate with other ETs.)
My interest in radio communication started in the Philippines.
My Dad showed me how to build radios and antennas,
and my Mom made sure I could find all the radio and antenna parts I needed. That's how this all started;
getting radio parts at Spark Radio and Electrical Supply in Quiapo, a district in Manila.
Acknowledgements
Many thanks go to many people for more than I have written here:
(I risk temporarily forgetting someone's help.)
Bob Conley (FPGAs),
Ray Johnson (too much to list),
Ray Johnson's SCC students (ditto),
Mike Walters (GPS),
Shiela Powell (PCBs),
Jim Brennan (Linux),
Shanuj Sarin (FPGAs),
Rich Maes (digital design),
Steve Kay (FFT PC board),
Phil Wilshire (RT Linux),
John, Robbie, Lissa, and Jena Richardson (flying),
Pat Brown (microwave),
Jules Gindraux (microwave),
Ken Olsen (PCBs),
Joe Dubner (microwave),
Jim Ehrhardt (microwave),
Dick Skinner (dish),
Ken Lyons (PCI),
Tom Faulkner (GPS),
Ken Thompson (camera)
Martin Howser (dishes),
Bob Besser (microwave),
Jake Laete (microwave),
Roy Anderson (radio telescope instrumentation),
Jerry Long (liquid Nitrogen),
Ed Mitchell (ham radio),
Gary Tong (SETI a long time ago),
George Moore (1-bit ADCs),
Jim Barrett (dishes),
Brooks Shera (GPS),
Bob Gray (lots of good ideas) at The Small SETI Observatory,
John Dreher (lots of good ideas),
everyone at The SETI Institute,
everyone at The Dominion Radio Astrophysical Observatory,
Barney Oliver (who sparked my interest in SETI, and whom I miss),
my brother Jeff (Astronomy),
my daughters Sarah (lots of good ideas) and Samantha (lots of good ideas),
and my Mom and Dad.
And thanks to the (approx.) fourteen people who moved the six meter dish!
Thanks to H. Paul Shuch and The SETI League.

Thanks to everyone at LinuxTeams.
LinuxTeamstm
A Division of L.A. Boone & Company, Inc.
|
And thanks to everyone at Agilent Technologies
(split from Hewlett-Packard Co.).

Seti is really cool
by Sarah Crilly
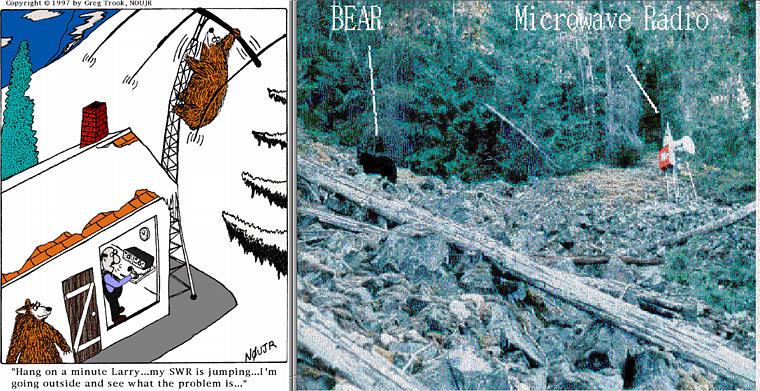
I help my Dad all the time when he works on Seti. I went to a Seti site and climbed a steep mossey mountain ( it was slippery, too)
to get to a microwave radio site. Later a bear visited the same spot. At home, there are cables all over the house for Seti.
I helped pull, measure and cut them
so they would be just perfect. At Dad's work, he uses his cubicle for Seti, too.
Over the past few years, Dad has accumulated several cubicles. He says his wires grow
like vines and just spread into cubicle after cubicle after cubicle- eating everything in their path! Anyway, I love doing Seti and learning new things. Even my school helped
find ways to transmit and receive messages. Dad and I, (along with all the other people who've contributed) would like to thank my sixth grade class.
Seti is really cool, continued
by Samantha Crilly
My sister wrote Seti is really cool so I Samantha wanted to write Seti is really cool, continued because my sister decided to write nothing about
me!!!!!!SARAH!!! Well anyway I would like to thank my 3rd grade class for contributing to my Dad's collection of stuff laying in the backyard.
They built the "wave disrupters" for "energy and matter" unit in science. Mrs. Barkley was fascinated with what my Dad said and his lectures.
So I am in 5th grade now and I am in a performance called, Oliver! I also might be performing in the Olympics in Sydney, Australia
for Ballet and Jazz. If you want tickets for Oliver call, (509) 325-Seat. The performances are February 10-13, 1999 at 7:00pm
in Spokane,Washington.
So nothing much
is going on. We haven't picked anything up yet. Don't be alarmed, aliens are not secretly coming to the Planet Earth.
We are going as fast as we can to set up everything!
(Skip's note 2/27/99: I helped Sarah and Samantha route eight radio telescope cables today. Samantha pulled and aligned
the heavy cables. I couldn't fit under the deck, so Sarah "army crawled" where the spiders and mice live,
pushing the cables through a small hole in the wall. Then we pushed them through a hole in the floor and into the receiver room.)
Some cross-correlator data files
1396314 Nov 27 12:00 cc1509_0.txt
1395980 Nov 28 12:00 cc1510_0.txt
73 de K7ETI
Thank you for visiting our web page.
(My email address is skip_crilly@agilent.com)
This page hosted by  Get your own Free Home Page